Analyze the live odd history and find out how the odds vary with match events!
The new Odds page on football matches will provide you with an all new dimension of past match analysis, to help you predict and draw up the best betting strategies for the future.
Have you always had the will to check the “Price/Volume over time” Betfair graphs after the matches were over?
Now, at the Academy, you have access to information telling you how the odds will vary in accordance with match time. All this and more because you will also have graph highlights of the major events of each match: goals, red cards, match start and end as well as half time breaks.
Now you have full access to a huge database of live and pre-live odds! On several markets for each match. Free for Academy members!
This is the tool you were missing to study your matches and develop your own EV+ strategies!
Now you can analyze live odds from past games and take advantage of that to choose the best entry moments for any given market. Finally you will know where the highest odd variations are, and how much profit they can make you!
Take advantage of the backlog: analyze the odd variation during the match, and the odd jumps caused by each goal. Finally you will be able to determine how big your profit will be if you manage to catch an early or late goal.
Betting academy exclusive
Now you can:
- Know how much you will profit if you bet against the favourite and no goals happen in the first 15 minutes;
- Know how much you will profit if you bet on the draw at half time on 0-0 matches and no goals get scored in the first 10 minutes of the second half;
- Know how much you will profit if you bet against the Over 2,5 at half time on 0-0 matches and there are no goals in the first 5 minutes of the second half;
- Know how much you will lose if you bet on the Over 1,5 at the start of the match and close your position at half time if 2 goals haven't been scored yet, this will allow you to know how many times you can choose the wrong match to bet on while still maintaining a long term profit;
- Etc., etc., etc…
You can't know where you're going, if you don't know where you came from.
Practical example
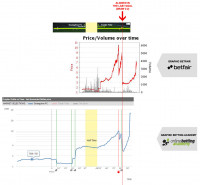
Here you can see a practical example of the Odd/Time graphs we've been talking about:
- Guangzhou vs Tianjin (Chinese Super League) June 4th, 2015 (link Graf Odds)
This match had 4 goals and a red card, it ended with a 2-2 draw. You can check below how the Academy Odd/Time graphs can be even more useful than those which Betfair provides.
Main differences:
- On the Academy Odd/Time graph the XX axis scales by the minute (live), this allows you to have a solid idea of the odd variation on a given time period (slope);
- On the other hand, on Betfair's Odd/Time graphs the XX axis is incremental with every matched bet, making it extend when that market selection is busier, making it seem that the odd drop was smoother than it actually was.
On the below images we can understand that the selection with the lowest odd was the one that had the most matched bets on the same timeframe, which increased the point number on that graph, stretching the XX axis.
Take full advantage of this new betting academy tool!
Enjoy you betting,
with quality strategies!


